Scientific Indicators of Climate Change

Liz Bentley
25 years: Meteorologist
How do we know climate change is happening? How can we measure the difference? Join Liz Bentley as she explores the temperature, ocean and glacial indicators of climate change.
How do we know climate change is happening? How can we measure the difference? Join Liz Bentley as she explores the temperature, ocean and glacial indicators of climate change.
Subscribe to watch
Access this and all of the content on our platform by signing up for a 7-day free trial.

Scientific Indicators of Climate Change
11 mins 28 secs
Key learning objectives:
Outline the different indicators of climate change
Understand how these indicators measure climate change
Overview:
We know climate change is happening because we can measure it across different indicators - namely temperature, oceans and glaciers. The data we've collected on temperature shows that it has risen globally by approximately 1.2°C in the last century. By tracking sea ice, it’s possible to see that we are losing about 13% of Arctic sea ice per decade. Global average sea levels from 1800-2021 have risen by between 21-24 cm, with sea levels around the Pacific islands rising at almost twice the global average.
Subscribe to watch
Access this and all of the content on our platform by signing up for a 7-day free trial.
What are the temperature indicators of climate change?
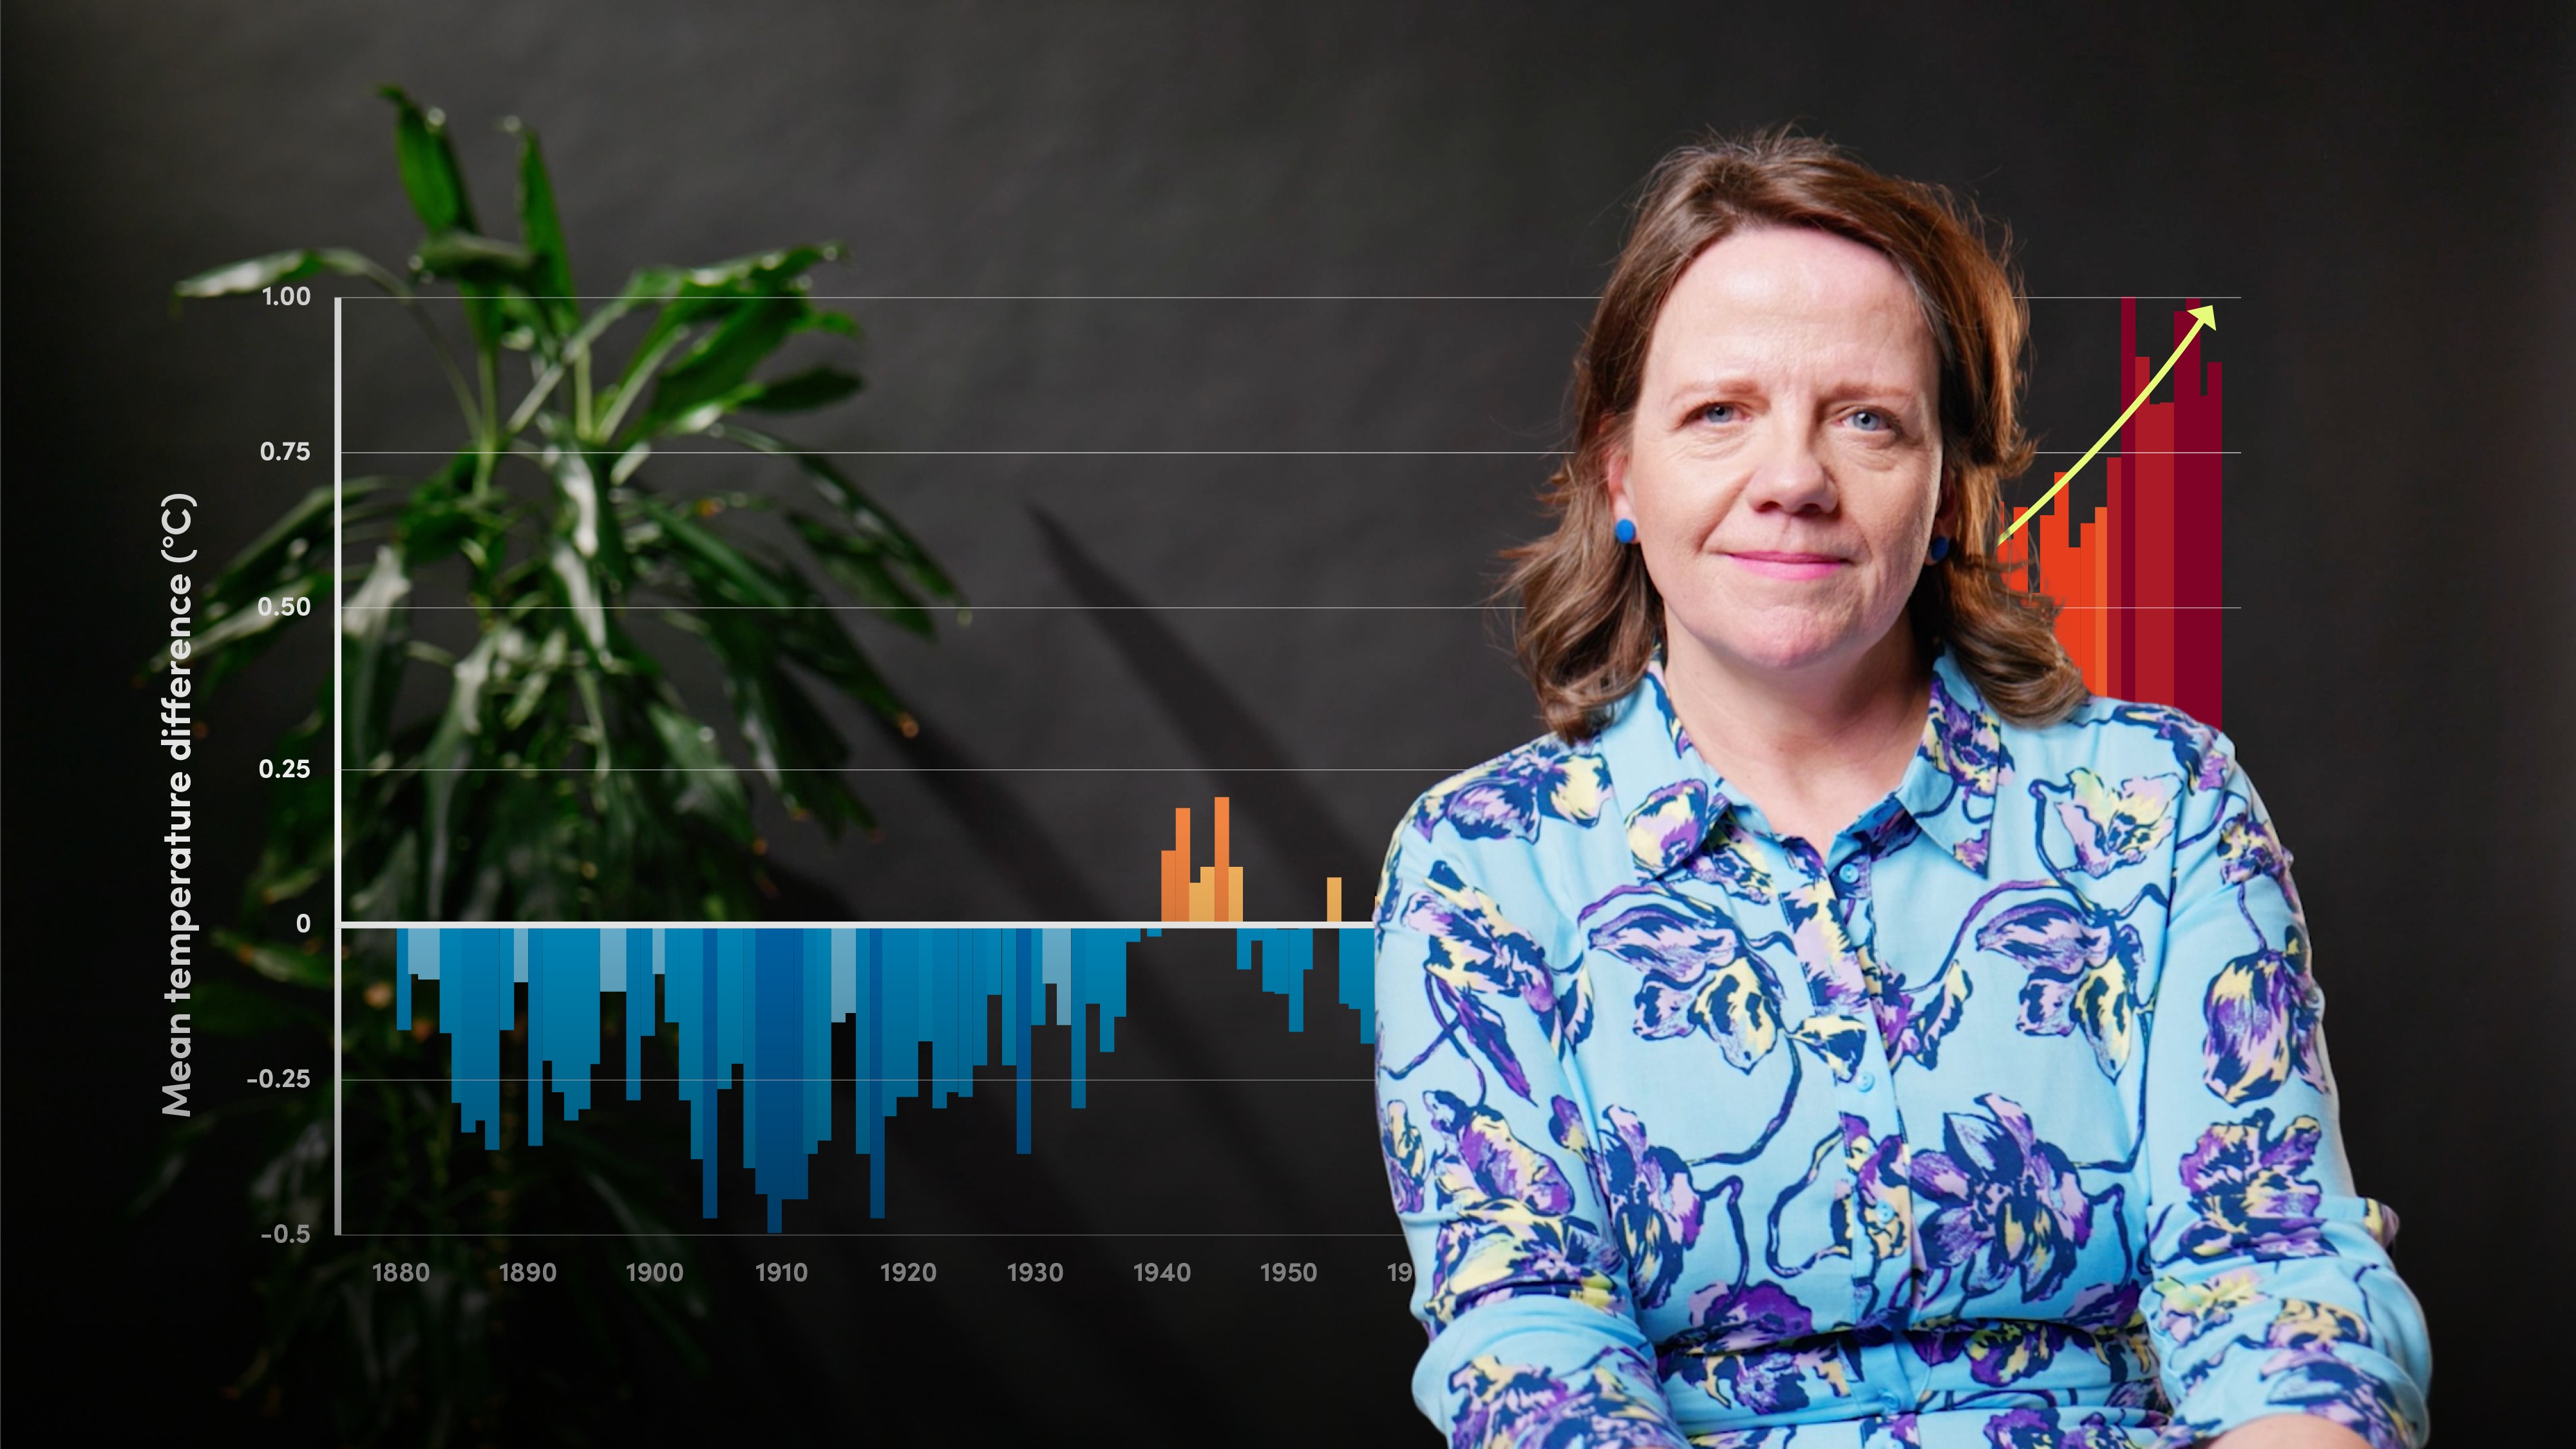
We have been collecting surface and ocean temperature for decades. The global average temperature has risen by approximately 1.2°C in the last century. There is variability from year to year, but there has been a steady increase in temperature over time, particularly in the last three or four decades.
What are the ocean indicators of climate change?
The oceans are warming. They absorb about 90% of the heat generated by rising greenhouse gas emissions, which in turn warms the oceans. This warming has multiple effects.
Sea ice is frozen seawater that floats on the ocean's surface, covering about 7% of the Earth’s surface and forming during winter and receding during summer. We are currently losing about 13% of Arctic sea ice per decade. In the past 30 years, the oldest and thickest ice in the Arctic has declined by 95%.
Carbon dioxide dissolves in seawater to produce carbonic acid - this has the effect of making the oceans more acidic (known as ocean acidification) and negatively impacts marine ecosystems.
We have also seen a doubling in the frequency of marine heatwaves since the 1970s, which have become more prolonged, intense and extensive. These marine heatwaves lead to coral bleaching, as the reef loses the life-sustaining algae when put under stress.
What are the glacial indicators of climate change?
Glaciers are slow-moving rivers of ice and cover around 10% of the world’s land surface and store about 70% of the Earth’s freshwater. Glaciers worldwide are retreating at an unprecedented rate and have accelerated over the past two decades. Meltwater from glaciers has contributed 0.74mm of sea level rise every year or around 15cm in the last 20 years.
What are the sea level indicators of climate change?
Global average sea levels from 1800-2021 have risen by between 21-24 cm. As the oceans warm, the water expands and takes up more volume (called thermal expansion). Sea level rise is not the same all around the world due to ocean dynamics and Earth's uneven gravity field. Sea levels around the Pacific islands (such as Tongo) are rising at almost twice the global average.
Subscribe to watch
Access this and all of the content on our platform by signing up for a 7-day free trial.

Liz Bentley
There are no available Videos from "Liz Bentley"


