Featured Pathways

More pathways

Banking Essentials - Part I

This pathway will walk us through the basics of banks, starting with some of the different types and their main functions, then starting to look at the regulation faced by the banks, both before and after the Global Financial Crisis.

Greenwashing

Greenwashing is the act of distributing false information about something being more environmentally friendly than it actually is.

More pathways

Book a demo

Pricing

Ready to get started?

Plans & Membership

Our Platform

Expert led content

+1,000 expert presented, on-demand video modules

Learning analytics

Keep track of learning progress with our comprehensive data

Interactive learning

Engage with our video hotspots and knowledge check-ins

Testing & certification

Gain CPD / CPE credits and professional certification

Managed learning

Build, scale and manage your organisation’s learning

Integrations

Connect Finance Unlocked to your current platform

Featured Content

More featured content

Tackling the Cost of Living Crisis

In this video, Max discusses the cost-of-living crisis currently enveloping the UK. He examines its impact on households as well as the overall economy.

CSR and Sustainability in Financial Services

In the first video of this two-part video series, Elisa introduces us to sustainability. She begins by looking at the difference between sustainability and corporate social responsibility, two terms that can be easily confused.

More featured content

Book a demo

Pricing

Ready to get started?

Book a demo

Pricing

Ready to get started?

The Monte Carlo Simulation in Excel

The Monte Carlo Simulation in Excel

Abdulla Javeri

30 years: Financial markets trader

In the previous video, Abdulla explained how Monte Carlo is a way of modelling a probability distribution of returns or prices. In this video, Abdulla examines the nature of stock returns to come up with a formula that can be used in Excel to simulate the price paths.

In the previous video, Abdulla explained how Monte Carlo is a way of modelling a probability distribution of returns or prices. In this video, Abdulla examines the nature of stock returns to come up with a formula that can be used in Excel to simulate the price paths.

Subscribe to watch

Access this and all of the content on our platform by signing up for a 7-day free trial.

The Monte Carlo Simulation in Excel

5 mins 9 secs

Overview

Monte Carlo is a way of modelling a probability distribution of returns or prices. In this particular case, changes in stock prices. This can be calculated by multiplying the spot price today by e to the power of a continuously compounded rate of return (r).

Key learning objectives:

  • Understand how to calculate changes in stock prices

  • Identify which two components make up rate (r)

  • Learn the formula we can input in excel for our simulations

Subscribe to watch

Access this and all of the content on our platform by signing up for a 7-day free trial.

Summary

What are some concepts you need to be familiar with?

  • Volatility
  • Variance
  • Probability distributions
  • How Monte Carlo works

How do we calculate changes in stock prices?

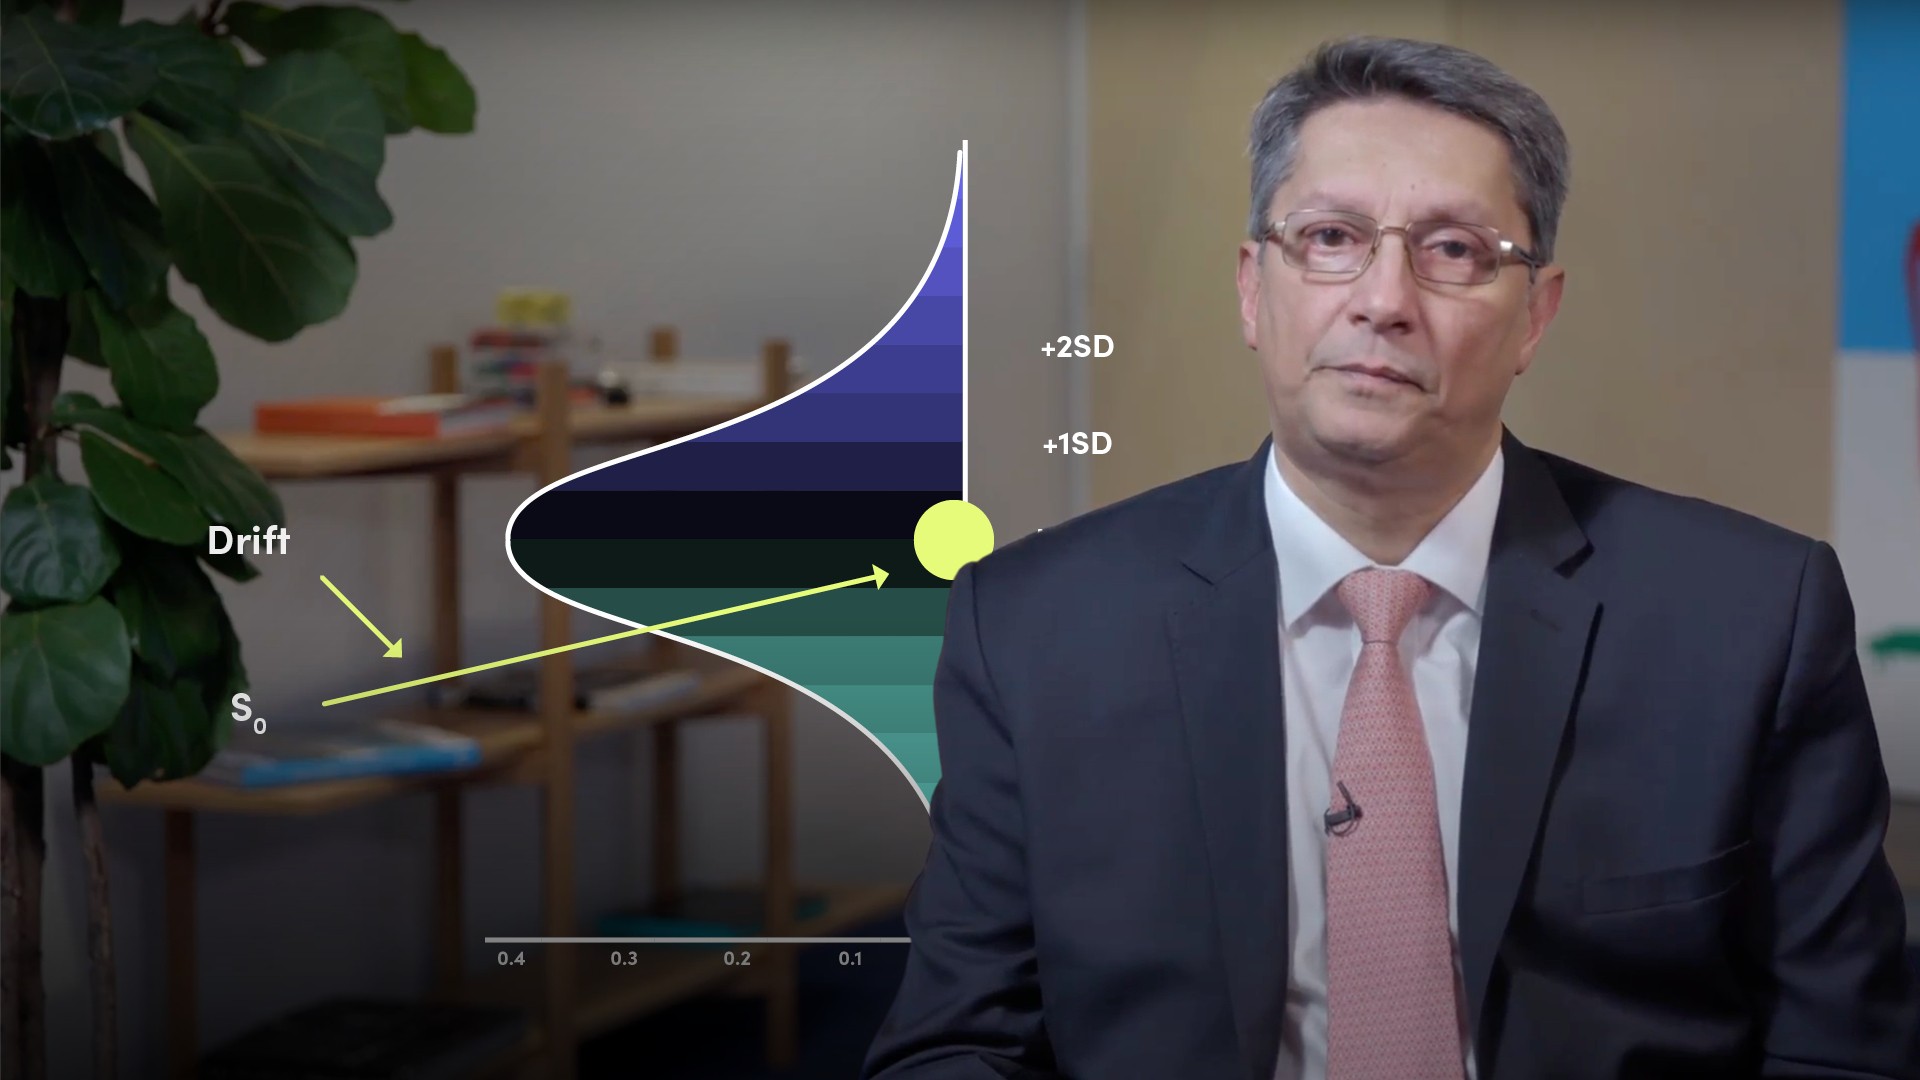
Changes in stock prices will usually be shown by the formula in the graphic below: tomorrow’s price will be today’s price multiplied by some continuously compounded rate of return. S1 = S0 x er S1: Price tomorrow S0: Price now er: Continuously compounded return for the period  

The rate (r) is made up of which two components?

  • Fixed Component
  • Random Component

What is the fixed component?

This is some rate by which the price drifts away from the current level over a given period. That is in turn made up of a constant drift rate and a stochastic element. The drift rate will usually be a risk-free rate for the period, or the average or an assumed return for that period. However, as trading results in fluctuating returns, the drift rate is subject to a drag that reduces it. Hence, the drift is the chosen drift rate minus the dragging element which is half the variance for that period. The ‘half the variance’ is the stochastic element which we accept as being correct.

What is the random component?

It picks a return randomly based on a probability distribution with the drift as the mean and an associated standard deviation or volatility. Often a normal or lognormal distribution is used for the probability distribution, because mathematically it keeps things relatively simple, but any appropriate distribution could be used.

Which formula can we input in excel for our simulations?

Exp(norm.inv(rand(),mean,stdev)

What is the benefit of using the Monte Carlo Simulation?

  • Particularly useful in the pricing of price dependant options, for example barriers options such as knock-ins and knock-outs
  • Flexible - it allows us to assume non-standard distributions. We could, for example, assume that the drift rate and/or the volatility are not constant and randomise or adjust those variables accordingly

Subscribe to watch

Access this and all of the content on our platform by signing up for a 7-day free trial.

Abdulla Javeri

Abdulla Javeri

Abdulla’s career in the financial markets started in 1990 when he entered the trading floor of the London International Financial Futures Exchange, LIFFE, and qualified as a pit trader in equity and equity index options. In 1996, Abdulla became a trainer for regulatory qualifications and then for non-exam courses, primarily covering all major financial products.

There are no available videos from "Abdulla Javeri"