


The Monte Carlo Simulation in Excel

Abdulla Javeri
Financial Markets Trader
In the previous video, Abdulla explained how Monte Carlo is a way of modelling a probability distribution of returns or prices. In this video, Abdulla examines the nature of stock returns to come up with a formula that can be used in Excel to simulate the price paths.

In the previous video, Abdulla explained how Monte Carlo is a way of modelling a probability distribution of returns or prices. In this video, Abdulla examines the nature of stock returns to come up with a formula that can be used in Excel to simulate the price paths.
Subscribe to watch
Access this and all of the content on our platform by signing up for a 7-day free trial.
The Monte Carlo Simulation in Excel
5 mins 9 secs
Key learning objectives:
Understand how to calculate changes in stock prices
Identify which two components make up rate (r)
Learn the formula we can input in excel for our simulations
Overview:
Monte Carlo is a way of modelling a probability distribution of returns or prices. In this particular case, changes in stock prices. This can be calculated by multiplying the spot price today by e to the power of a continuously compounded rate of return (r).
Subscribe to watch
Access this and all of the content on our platform by signing up for a 7-day free trial.
What are some concepts you need to be familiar with?
- Volatility
- Variance
- Probability distributions
- How Monte Carlo works
How do we calculate changes in stock prices?
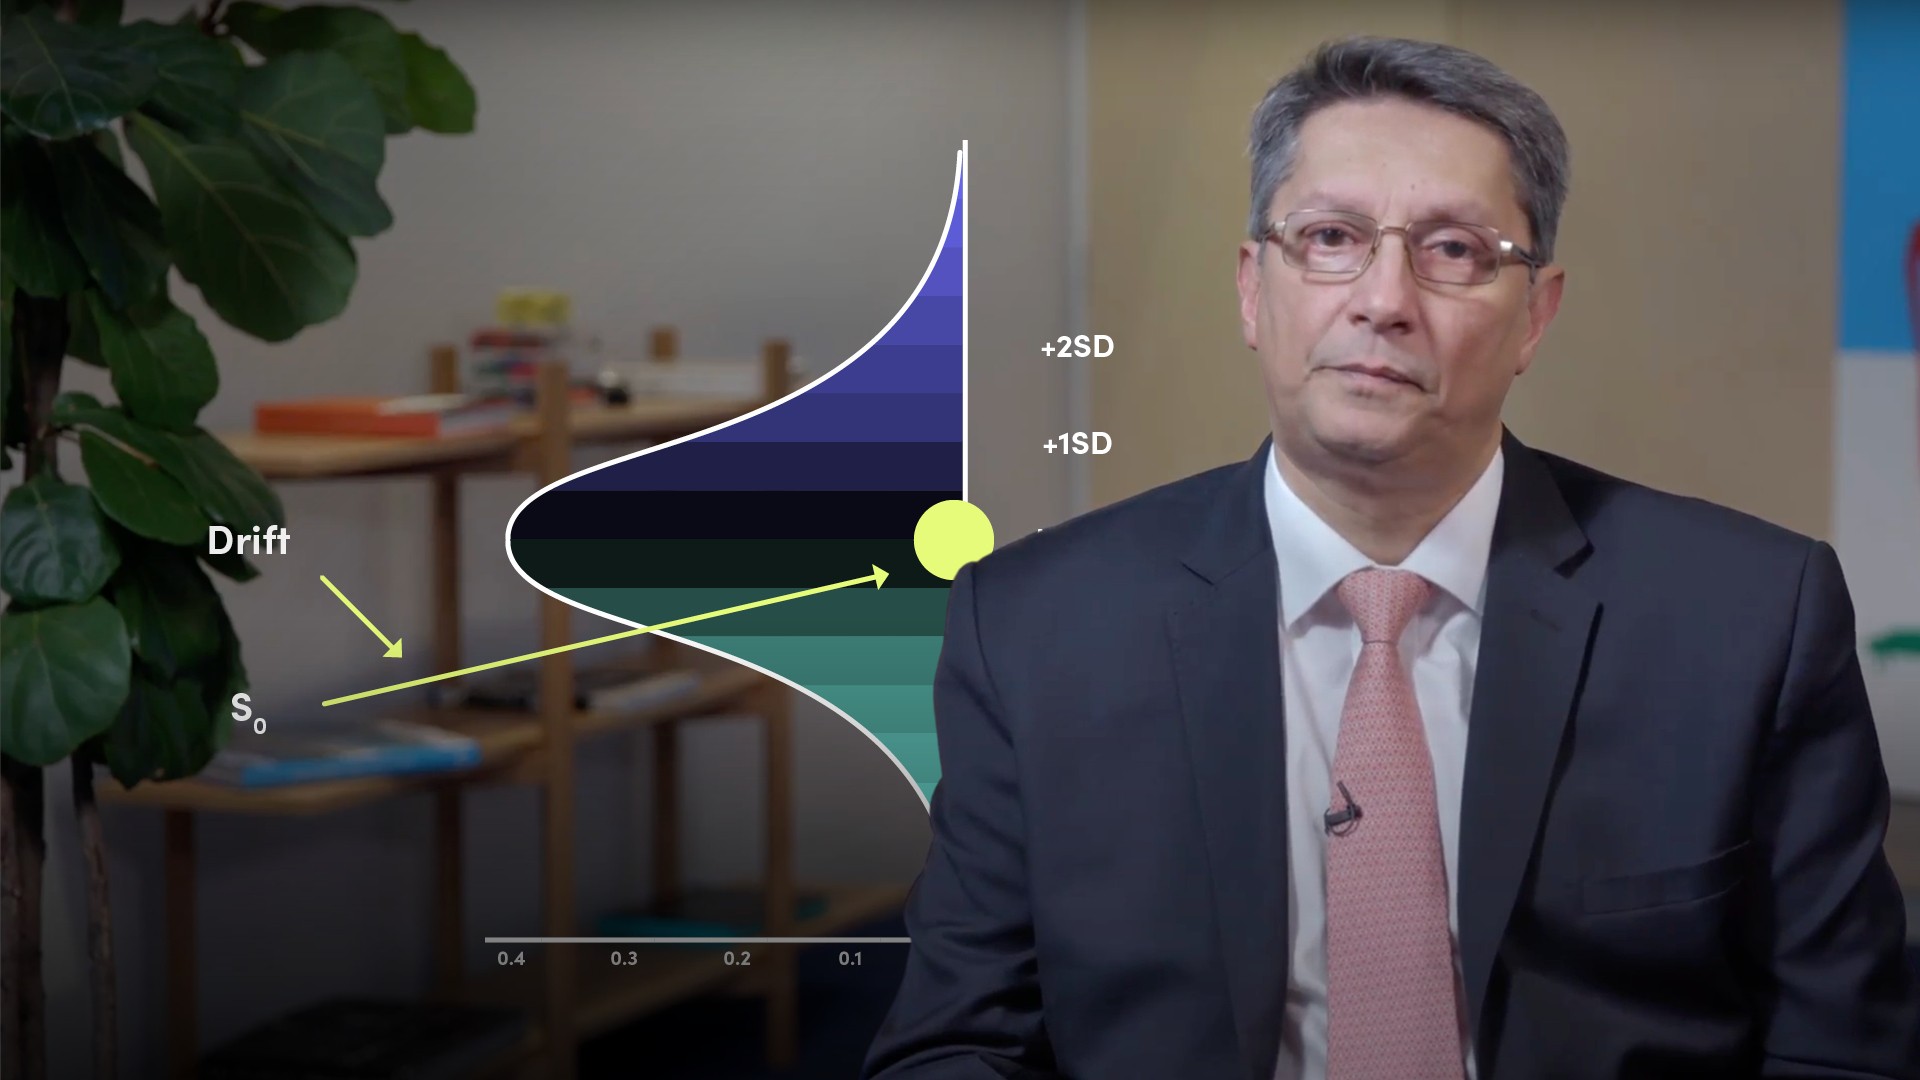
Changes in stock prices will usually be shown by the formula in the graphic below: tomorrow’s price will be today’s price multiplied by some continuously compounded rate of return. S1 = S0 x er S1: Price tomorrow S0: Price now er: Continuously compounded return for the periodThe rate (r) is made up of which two components?
- Fixed Component
- Random Component
What is the fixed component?
This is some rate by which the price drifts away from the current level over a given period. That is in turn made up of a constant drift rate and a stochastic element. The drift rate will usually be a risk-free rate for the period, or the average or an assumed return for that period. However, as trading results in fluctuating returns, the drift rate is subject to a drag that reduces it. Hence, the drift is the chosen drift rate minus the dragging element which is half the variance for that period. The ‘half the variance’ is the stochastic element which we accept as being correct.What is the random component?
It picks a return randomly based on a probability distribution with the drift as the mean and an associated standard deviation or volatility. Often a normal or lognormal distribution is used for the probability distribution, because mathematically it keeps things relatively simple, but any appropriate distribution could be used.Which formula can we input in excel for our simulations?
Exp(norm.inv(rand(),mean,stdev)What is the benefit of using the Monte Carlo Simulation?
- Particularly useful in the pricing of price dependant options, for example barriers options such as knock-ins and knock-outs
- Flexible - it allows us to assume non-standard distributions. We could, for example, assume that the drift rate and/or the volatility are not constant and randomise or adjust those variables accordingly
Subscribe to watch
Access this and all of the content on our platform by signing up for a 7-day free trial.

Abdulla Javeri
There are no available Videos from "Abdulla Javeri"