Categories
Discover our Courses


Featured Pathways
More pathways

Banking Essentials - Part I
This pathway will walk us through the basics of banks, starting with some of the different types and their main functions, then starting to look at the regulation faced by the banks, both before and after the Global Financial Crisis.

Greenwashing
Greenwashing is the act of distributing false information about something being more environmentally friendly than it actually is.
More pathways
Ready to get started?
Plans & Membership
Find the right plan for you


Our Platform

Expert led content
+1,000 expert presented, on-demand video modules
Learning analytics
Keep track of learning progress with our comprehensive data
Interactive learning
Engage with our video hotspots and knowledge check-ins
Testing & certification
Gain CPD / CPE credits and professional certification
Managed learning
Build, scale and manage your organisation’s learning
Integrations
Connect Finance Unlocked to your current platform
Featured Content
More featured content
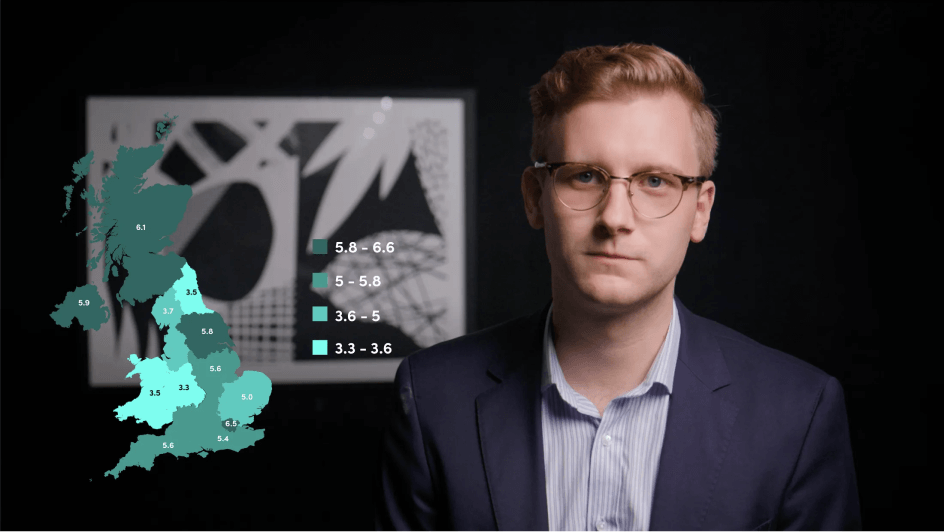
Tackling the Cost of Living Crisis
In this video, Max discusses the cost-of-living crisis currently enveloping the UK. He examines its impact on households as well as the overall economy.
CSR and Sustainability in Financial Services
In the first video of this two-part video series, Elisa introduces us to sustainability. She begins by looking at the difference between sustainability and corporate social responsibility, two terms that can be easily confused.
More featured content
Ready to get started?
Our Solutions
About Us


Testimonials
More testimonials

Mark Homans
Our sky high NPS following learner feedback speaks for itself - this platform has delivered a lot of value.

Fiona Quinn
Learning is accessible and the tool assists in the continued development of all our employees. It is a fantastic tool for our business!
More testimonials
Ready to get started?

Individual
1 learner
Learn at your own pace with insights and guidance from the world’s leading experts in finance.
Over 1,250 interactive videos
Over 200 of the leading experts
CPD accredited learning
7 day free trial
More details

Teams
2 - 250 learners
Easily manage learning for teams of up to 250 learners. Get started right away.
2-250 learners
Shared learner support team
Standard platform analytics
7 day free trial
More details

Enterprise
250+ learners
Learning management tools and bespoke content plans to suit organisations of any size.
250+ learners
Dedicated account management
Customised learning analytics
Bespoke content and learning
More details
Testimonials
More testimonials

Mark Homans
Our sky high NPS following learner feedback speaks for itself - this platform has delivered a lot of value.

Fiona Quinn
Learning is accessible and the tool assists in the continued development of all our employees. It is a fantastic tool for our business!
More testimonials
Ready to get started?
Categories
Discover our Courses
Featured Pathways
More pathways
Banking Essentials - Part I
This pathway will walk us through the basics of banks, starting with some of the different types and their main functions, then starting to look at the regulation faced by the banks, both before and after the Global Financial Crisis.
Greenwashing
Greenwashing is the act of distributing false information about something being more environmentally friendly than it actually is.
More pathways
Ready to get started?
Plans & Membership
Find the right plan for you
Our Platform
Expert led content
+1,000 expert presented, on-demand video modules
Learning analytics
Keep track of learning progress with our comprehensive data
Interactive learning
Engage with our video hotspots and knowledge check-ins
Testing & certification
Gain CPD / CPE credits and professional certification
Managed learning
Build, scale and manage your organisation’s learning
Integrations
Connect Finance Unlocked to your current platform
Featured Content
More featured content
Tackling the Cost of Living Crisis
In this video, Max discusses the cost-of-living crisis currently enveloping the UK. He examines its impact on households as well as the overall economy.
CSR and Sustainability in Financial Services
In the first video of this two-part video series, Elisa introduces us to sustainability. She begins by looking at the difference between sustainability and corporate social responsibility, two terms that can be easily confused.
More featured content
Ready to get started?
Our Solutions
About Us
Testimonials
More testimonials
Mark Homans
Our sky high NPS following learner feedback speaks for itself - this platform has delivered a lot of value.
Fiona Quinn
Learning is accessible and the tool assists in the continued development of all our employees. It is a fantastic tool for our business!
More testimonials
Ready to get started?
Individual
1 learner
Learn at your own pace with insights and guidance from the world’s leading experts in finance.
Over 1,250 interactive videos
Over 200 of the leading experts
CPD accredited learning
7 day free trial
More details
Teams
2 - 250 learners
Easily manage learning for teams of up to 250 learners. Get started right away.
2-250 learners
Shared learner support team
Standard platform analytics
7 day free trial
More details
Enterprise
250+ learners
Learning management tools and bespoke content plans to suit organisations of any size.
250+ learners
Dedicated account management
Customised learning analytics
Bespoke content and learning
More details
Testimonials
More testimonials
Mark Homans
Our sky high NPS following learner feedback speaks for itself - this platform has delivered a lot of value.
Fiona Quinn
Learning is accessible and the tool assists in the continued development of all our employees. It is a fantastic tool for our business!
More testimonials
Ready to get started?