


The Brinson (Equities) Attribution Model

Ali Chabaane
Investment Management Expert
In the previous video, Ali explained why performance attribution is important for an asset management firm. He also outlined a few examples and how we interpret them. In this video, he goes deeper into some of the theories behind these performance attribution reports and how they are constructed.

In the previous video, Ali explained why performance attribution is important for an asset management firm. He also outlined a few examples and how we interpret them. In this video, he goes deeper into some of the theories behind these performance attribution reports and how they are constructed.
Subscribe to watch
Access this and all of the content on our platform by signing up for a 7-day free trial.
The Brinson (Equities) Attribution Model
11 mins 21 secs
Key learning objectives:
Outline how the Brinson model was developed and what it can be used for
Understand the maths behind the model
Outline the pros and cons of the model
Overview:
There are several different models that can be used for performance attribution, one of which is the Brinson, Hood, Beebower model, more commonly known as just the Brinson model. It is specifically suited for use when the portfolio is measured against a specific benchmark and it focuses on stock selection and asset allocation.
Subscribe to watch
Access this and all of the content on our platform by signing up for a 7-day free trial.
How was the Brinson model developed and what can it be used for?
The model was derived from a series of research papers from the 1980s, the most well-known of which is ‘Determinants of Portfolio Performance’ published by Brinson, Hood, and Beebower in 1986.
The model is now the most widely used model for performance attribution among equity professionals and is specifically suited for use when the portfolio is measured against a benchmark (an index or a combination of market indices).
To perform the model the portfolio and benchmark need partitioning into groups (if the PMs choice). The first decision assessed is how the PM is allocating capital across the groups versus the benchmark. The difference between the weights in the portfolios and those in the benchmark is the active allocation decision. The second decision assessed is how the PM is selecting for each group versus the neutral selection provided by the benchmark. The performance coming from holding different stocks compared to those in the benchmark is what we call the stock selection effect. The objective of the model is to then estimate the value added of each of these two strategies.
What is the maths behind the Brinson model?
However, this is just the first stage, to complete the analysis, we need to consider two specific cases:
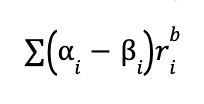
- PM invests in the same names as the benchmark but with different group weights. In this case performance would only reflect the allocation decision and would be calculated using the following formula:
- The PM is allocating the same weights in the portfolio as those in the benchmark, but is using different names. Performance would be reflected by the selection decision and would be calculated using:
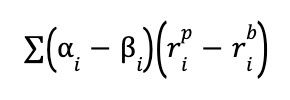
We have now measured the performance of the two decisions, however when added, the two components don’t equal total excess return, there is an interaction effect between the selection and allocation decisions. It is the benefit or penalty coming from having the two decisions both in the same direction or having them in opposite directions. E.g. If both of the decisions result in a positive outcome, there is an additional benefit for allocating more stocks that are doing better. Interaction is expressed as:
What are the pros and cons of the model?
Pros:
- In the fund industry there is a predominance of stock selection strategies in equity portfolios, the model covers these decisions
- The simplicity and standard nature of the model allow it to be deployed easily
Cons:
- Needs a portfolio and a benchmark
- No standard way of interpreting the interaction effect
- Chosen grouping has to be in line with the portfolio manager’s decision framework
- In multiple grouping dimensions, we cannot aggregate the interpretations to derive a robust measure of the overall portfolio manager’s skills
- Investment decisions are too complex to be summarised by just allocation and selection
Subscribe to watch
Access this and all of the content on our platform by signing up for a 7-day free trial.

Ali Chabaane
There are no available Videos from "Ali Chabaane"