Featured Pathways

More pathways

Banking Essentials - Part I

This pathway will walk us through the basics of banks, starting with some of the different types and their main functions, then starting to look at the regulation faced by the banks, both before and after the Global Financial Crisis.

Greenwashing

Greenwashing is the act of distributing false information about something being more environmentally friendly than it actually is.

More pathways

Book a demo

Pricing

Ready to get started?

Plans & Membership

Our Platform

Expert led content

+1,000 expert presented, on-demand video modules

Learning analytics

Keep track of learning progress with our comprehensive data

Interactive learning

Engage with our video hotspots and knowledge check-ins

Testing & certification

Gain CPD / CPE credits and professional certification

Managed learning

Build, scale and manage your organisation’s learning

Integrations

Connect Finance Unlocked to your current platform

Featured Content

More featured content

Tackling the Cost of Living Crisis

In this video, Max discusses the cost-of-living crisis currently enveloping the UK. He examines its impact on households as well as the overall economy.

CSR and Sustainability in Financial Services

In the first video of this two-part video series, Elisa introduces us to sustainability. She begins by looking at the difference between sustainability and corporate social responsibility, two terms that can be easily confused.

More featured content

Book a demo

Pricing

Ready to get started?

Book a demo

Pricing

Ready to get started?

Measuring Volatility

Measuring Volatility

Abdulla Javeri

30 years: Financial markets trader

Volatility can be measured for any period. In this video, Abdulla explains the two ways to convert from one period to another.

Volatility can be measured for any period. In this video, Abdulla explains the two ways to convert from one period to another.

Subscribe to watch

Access this and all of the content on our platform by signing up for a 7-day free trial.

Measuring Volatility

4 mins 34 secs

Overview

Volatility can be measured in two ways – the direct method and the variance method. Both are explained and calculated.

Key learning objectives:

  • Calculate volatility using the variance method and the direct method

Subscribe to watch

Access this and all of the content on our platform by signing up for a 7-day free trial.

Summary

How do we measure volatility?

Volatility can be measured for any period that we want. To convert into an annualised figure or for any other period takes a bit of simple manipulation. For example if we know that the annual volatility is 15%, we can work out the equivalent quarterly or daily volatility. Or if we have a daily volatility of 0.20%, we can work out what that means in terms of an annual figure and so on. There are two ways to convert from one period to another. Directly, which involves using square roots because volatility is a function of the square root of time, or by applying the variance method. That’s possibly more intuitive, but involves more steps.

How do we calculate volatility using the direct method?

To convert directly we take the volatility figure for the period we have and multiply or divide by the relevant ratio to get the figure for the period we want. The ratio is the square root of the number of days in the longer period divided by the number of days in the shorter period. Multiply if going from a shorter to a longer period and divide to go from a longer period to a shorter one.

How do we calculate volatility using the variance method?

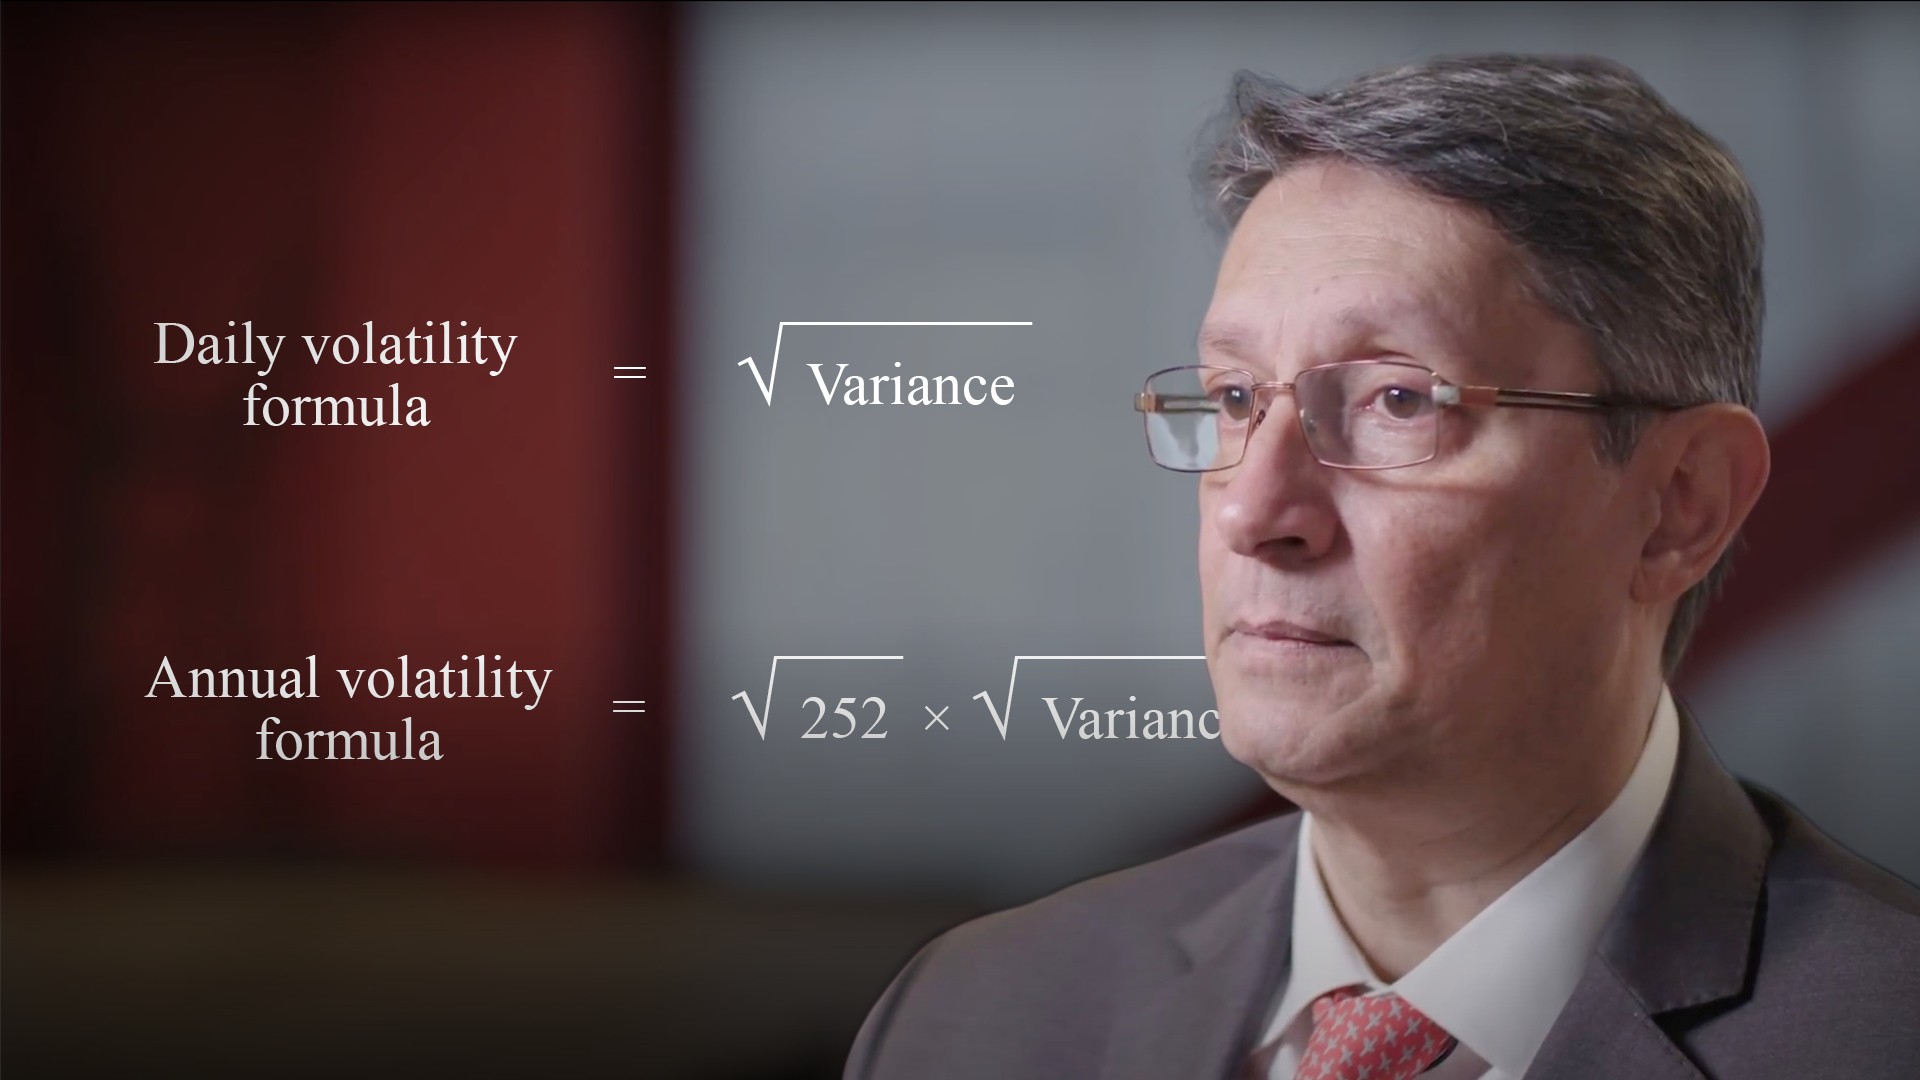
Moving on to the variance method. Variance is linear with respect to time. Take the measured volatility, and square it. Multiply it by the ratio of long period days to short period days if going from short to long, or divide, if moving from long to short. Finally, take the square root of the result.

Subscribe to watch

Access this and all of the content on our platform by signing up for a 7-day free trial.

Abdulla Javeri

Abdulla Javeri

Abdulla’s career in the financial markets started in 1990 when he entered the trading floor of the London International Financial Futures Exchange, LIFFE, and qualified as a pit trader in equity and equity index options. In 1996, Abdulla became a trainer for regulatory qualifications and then for non-exam courses, primarily covering all major financial products.

There are no available videos from "Abdulla Javeri"