


Value at Risk

Abdulla Javeri
30 years: Financial markets trader
In the third part of Abdulla's series on volatility, Abdulla will work through an example of the use of volatility in the area of risk management. For this video, viewers will need to be familiar with cumulative distribution functions and z-scores.

In the third part of Abdulla's series on volatility, Abdulla will work through an example of the use of volatility in the area of risk management. For this video, viewers will need to be familiar with cumulative distribution functions and z-scores.
Subscribe to watch
Access this and all of the content on our platform by signing up for a 7-day free trial.
Value at Risk
3 mins 58 secs
Key learning objectives:
Understand how volatility can be used to manage risk
Overview:
Volatility is pertinent to managing risk. Below is an example of how we can calculate volatility using Excel.
Subscribe to watch
Access this and all of the content on our platform by signing up for a 7-day free trial.
Why conduct a Value at Risk (VaR) calculation?
Assume we’re an asset manager holding an equity portfolio currently valued at one million. Whilst we are expecting to make positive returns over time we’re always concerned with the prospect of a short term fall in its value. We’d like an idea of the maximum potential short term loss in current conditions or perhaps, if markets are turbulent, we could be forgiven for thinking that the maximum loss is a million, the total value. But what are the chances of losing 100% of the portfolio value in say the next 10 days? In normal market conditions, that's going to be very small, especially for a diversified portfolio. It would also be useful to know how confident we are that the loss is not going to be larger than the expected number. In the jargon we’ll be conducting a Value at Risk or VaR calculation.
What factors are necessary for calculating the maximum expected loss?
To calculate the maximum expected loss we need two things:
- Firstly, a volatility figure, say annual volatility of 15.06%. We can convert that into a 10 day volatility of 3.00%.
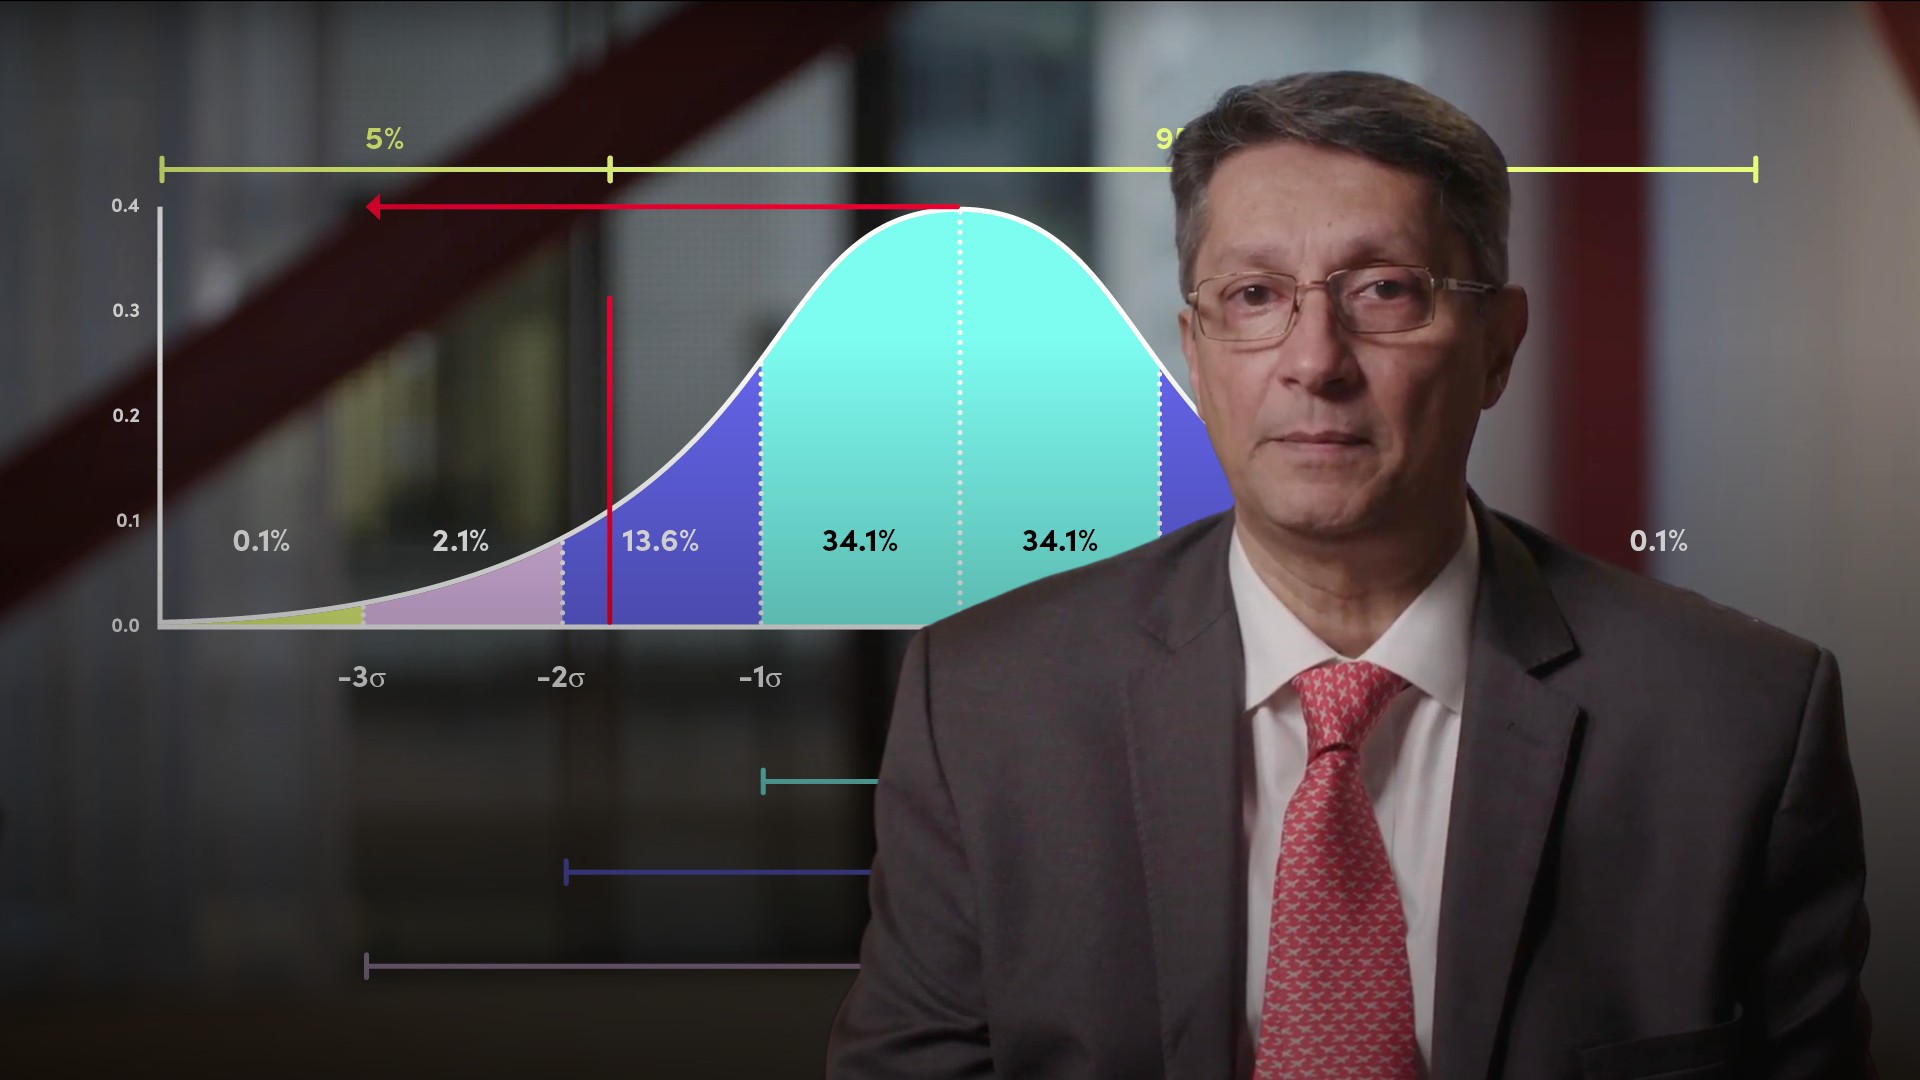
- Secondly, we need a confidence level associated with the expected loss, say a 95% confidence level. So we only expect to lose more than our figure 5.00% of the time.
To keep things simple we’ll assume that the value of the portfolio is normally distributed. We’re not going to overly concern ourselves with the fact that the normal distribution implies that the value could go negative, because we are only talking about a 10 day period. So our starting point is at the centre of the standard normal probability distribution in the graphic. We’re concerned with the area to the left where we suffer a loss. We want to find the value of the portfolio such that 95% percent of the area under that curve lies to the right of that point, and the area to the left, the cumulative distribution, is 5.00%.
How do you calculate the VaR using Excel?
We can do the calculation in a couple of ways. Start at the centre with a mean of one million and 10 day standard deviation of 30,000 which is 3.00% of a million. Using an Excel spreadsheet and the norm.inv function enter the inputs: 0.05 for probability, one million for mean and 30,000 for standard deviation. The portfolio value at that point is 950,654. Subtract that from a million, giving you a loss of 49,346.
The more direct way is to use z-scores. Use the norm.s.inv function and input the area to the left of our chosen level, 5.00%. The result approximately -1.64 is in standard deviations from the mean. The loss will be one million multiplied by 3.00% multiplied by -1.64 giving a figure -49,346. Alternatively, simply multiply the standard deviation 30,000 by the z-score. In words, we’re saying that we’re 95% confident that we won’t lose more than 49,364 in 10 days. A note of caution though, 95% seems like a high figure, however, it also means you could lose more than that in five percent of those periods.
Subscribe to watch
Access this and all of the content on our platform by signing up for a 7-day free trial.

Abdulla Javeri
There are no available Videos from "Abdulla Javeri"