Featured Pathways

More pathways

Banking Essentials - Part I

This pathway will walk us through the basics of banks, starting with some of the different types and their main functions, then starting to look at the regulation faced by the banks, both before and after the Global Financial Crisis.

Greenwashing

Greenwashing is the act of distributing false information about something being more environmentally friendly than it actually is.

More pathways

Book a demo

Ready to get started?

Our Platform

Expert led content

+1,000 expert presented, on-demand video modules

Learning analytics

Keep track of learning progress with our comprehensive data

Interactive learning

Engage with our video hotspots and knowledge check-ins

Testing & certification

Gain CPD / CPE credits and professional certification

Managed learning

Build, scale and manage your organisation’s learning

Integrations

Connect Finance Unlocked to your current platform

Featured Content

More featured content

Tackling the Cost of Living Crisis

In this video, Max discusses the cost-of-living crisis currently enveloping the UK. He examines its impact on households as well as the overall economy.

CSR and Sustainability in Financial Services

In the first video of this two-part video series, Elisa introduces us to sustainability. She begins by looking at the difference between sustainability and corporate social responsibility, two terms that can be easily confused.

More featured content

Book a demo

Ready to get started?

Book a demo

Ready to get started?

VaR Using Historical Simulation

VaR Using Historical Simulation

Gurdip Dhami

25 years: Treasury & ratings

Discover how Historical Simulation estimates VaR using real past market moves. See how percentile-based losses define risk, how to scale 1-day VaR to longer horizons, and why data quality and time periods are critical to reliable results.

Discover how Historical Simulation estimates VaR using real past market moves. See how percentile-based losses define risk, how to scale 1-day VaR to longer horizons, and why data quality and time periods are critical to reliable results.

Subscribe to watch

Access this and all of the content on our platform by signing up for a 7-day free trial.

VaR Using Historical Simulation

16 mins 43 secs

Key learning objectives:

  • Understand how Historical Simulation uses real market data to estimate potential portfolio losses

  • Apply the six steps of the Historical Simulation VaR method in Excel or Python

  • Calculate percentile-based risk measures for different confidence levels and convert 1-day VaR to 1-month VaR

  • Interpret VaR results and recognise the assumptions and limitations of the method

Overview:

Historical Simulation estimates VaR by using real historical market movements to understand how a portfolio could perform under similar conditions today. Instead of relying on assumed distributions, it directly applies past price changes to current exposures, generating a full set of hypothetical portfolio returns. Once the simulated returns are produced, they are ordered and the percentile matching the confidence level, such as the 5th percentile for 95%, defines the loss threshold. VaR is quoted as a positive number, even though it represents a loss. A longer-horizon VaR can be derived from the 1-day result using the square-root-of-time rule when independence and stability assumptions reasonably hold.

Subscribe to watch

Access this and all of the content on our platform by signing up for a 7-day free trial.

Summary
How does the Historical Simulation method estimate VaR in practice?
Historical Simulation applies the actual sequence of past market movements to today’s portfolio to estimate how much it could lose. Each historical data point generates a hypothetical revaluation: the market moves exactly as it did then, but the exposure is today’s. This produces thousands of daily profit-or-loss figures — one for each historical day — forming a distribution of realised outcomes rather than assumed behaviour.

Because it relies purely on historical returns, the method:
  • Captures real market features such as volatility clustering, shocks, and fat tails.
  • Avoids assumptions about how returns are distributed.
  • Is transparent and easy to audit, since every result can be traced to a real past event.

The quality of the output depends heavily on the relevance and length of the historical period chosen, too short and risk may be underestimated; too long and outdated market conditions may distort results.

How does the percentile of simulated returns translate into VaR?
Once simulated returns are calculated, they are ranked from the largest loss to the largest gain. The VaR threshold is set by the percentile associated with the confidence level — the point where only a small percentage of worse outcomes remain.
For example:
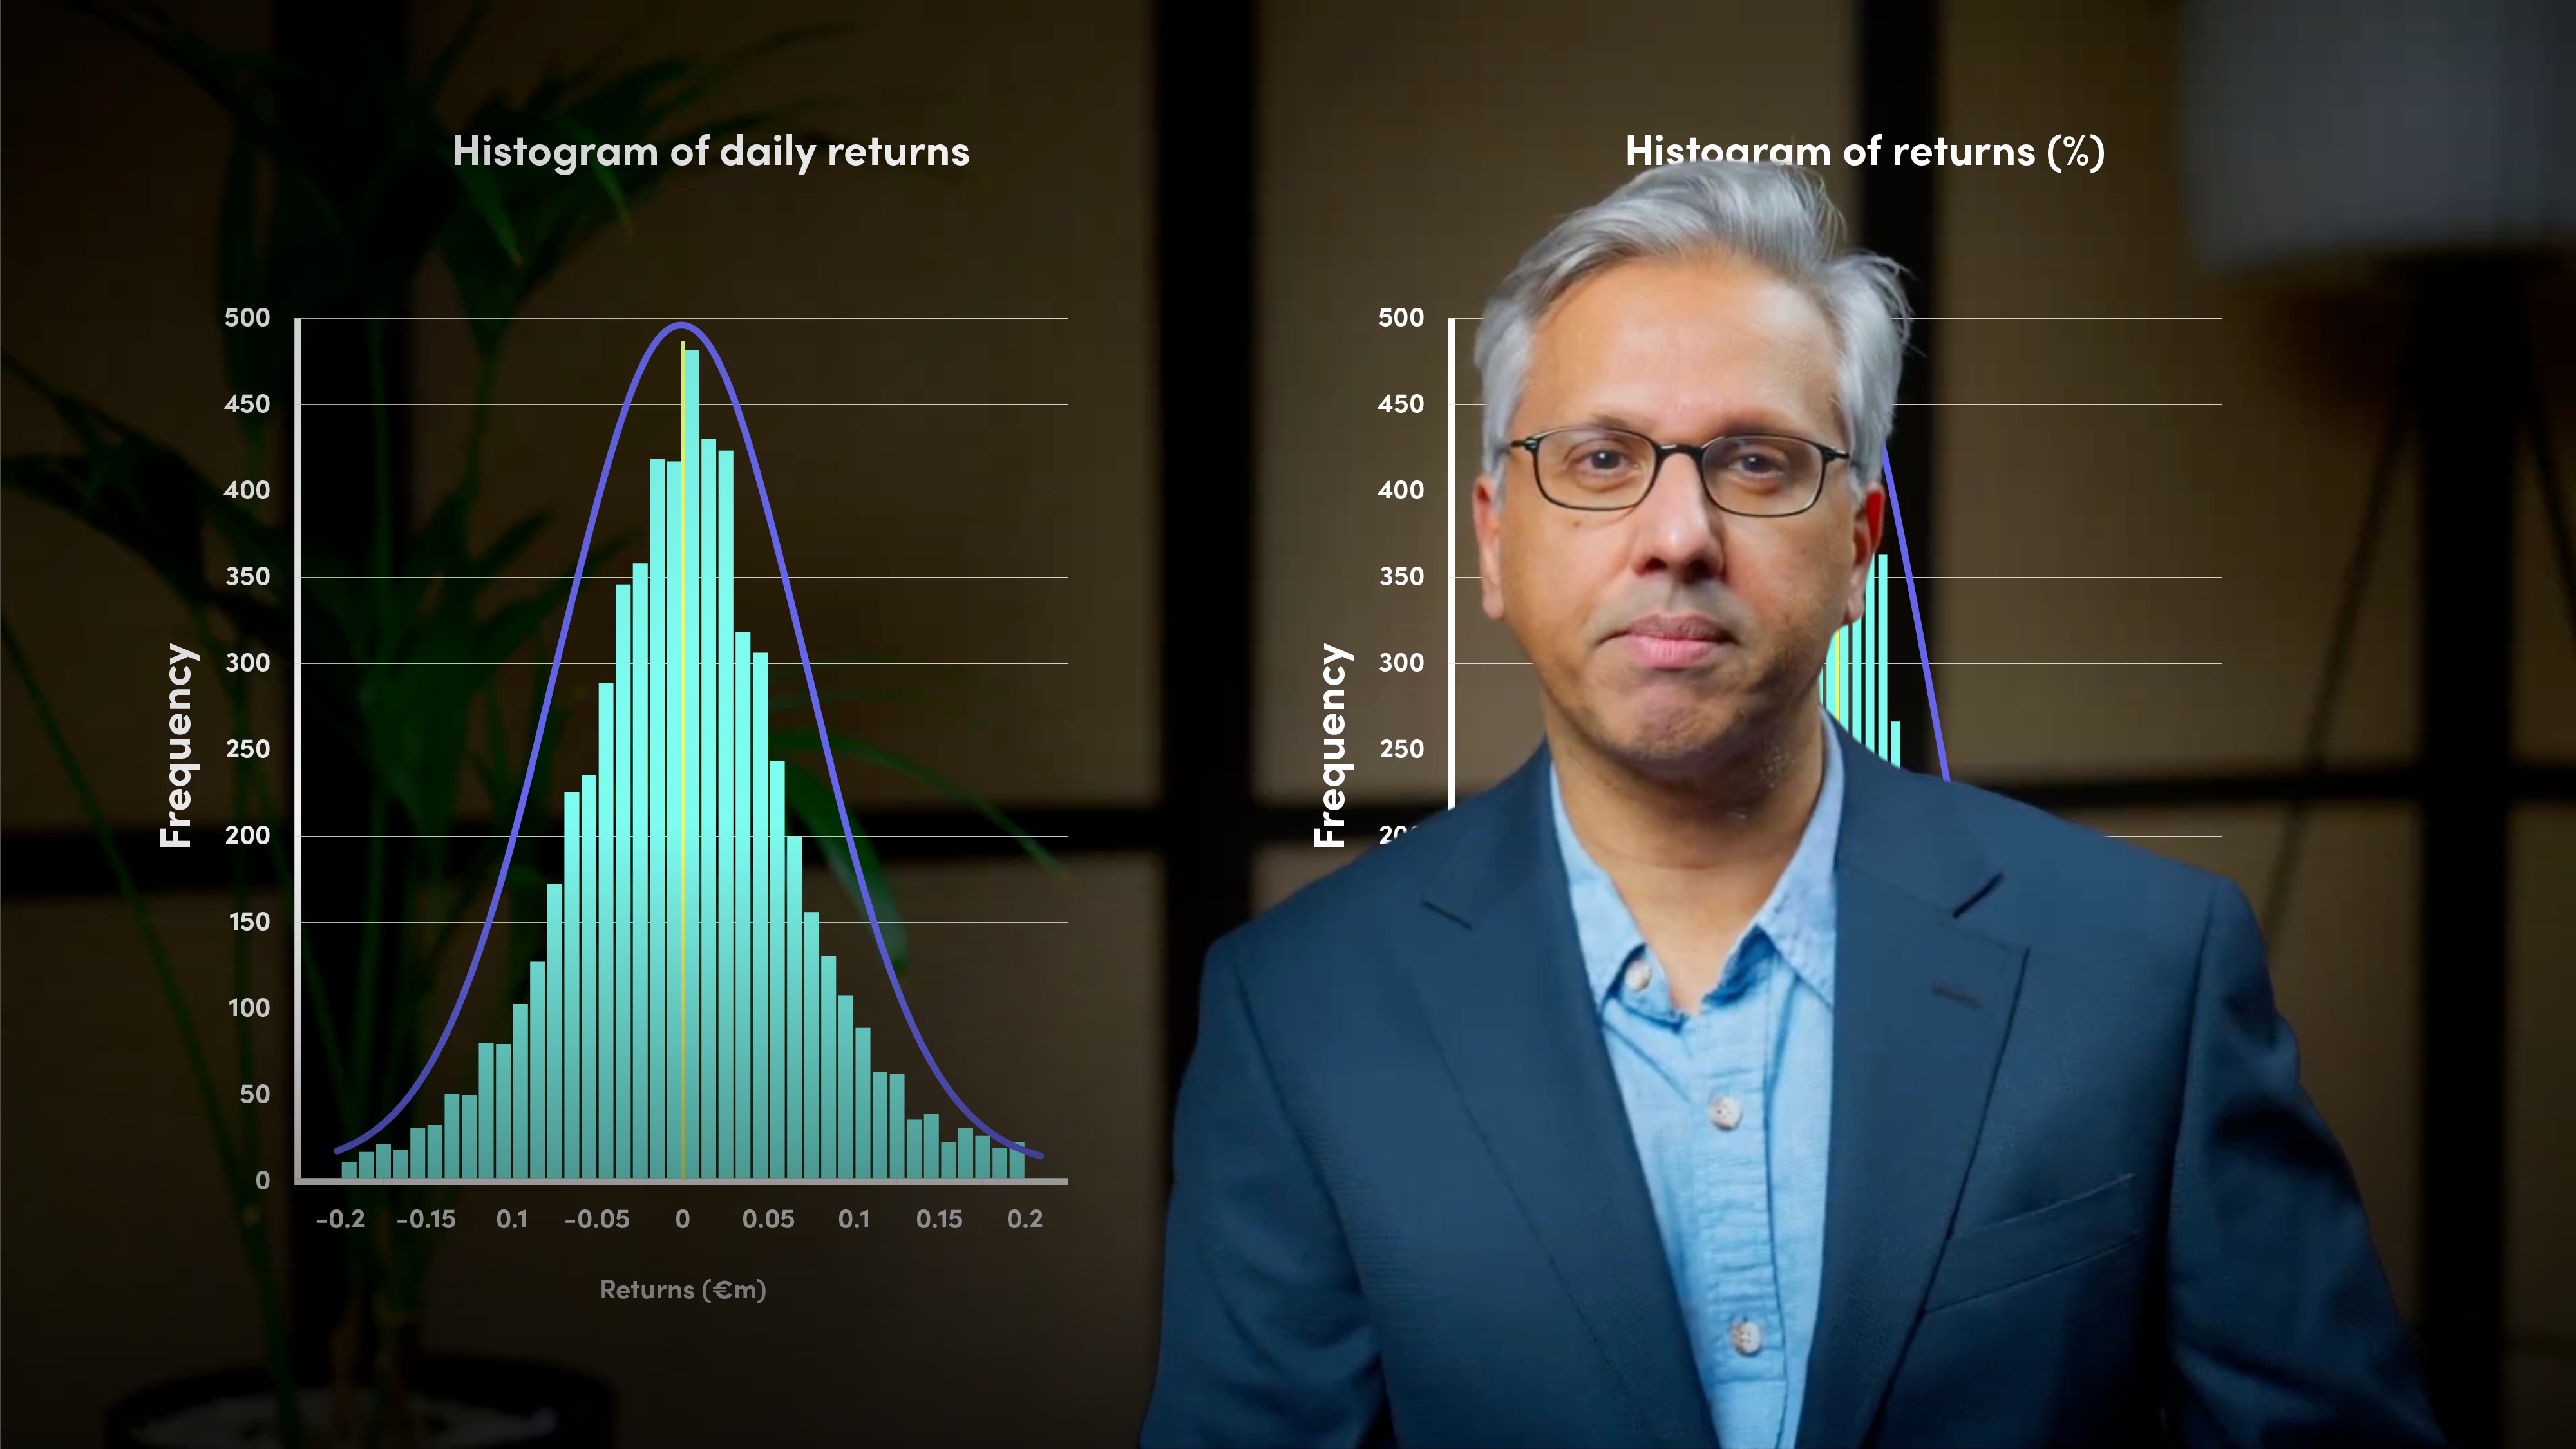
  • A 95% confidence level → focus on the 5th percentile loss
  • A 99% confidence level → focus on the 1st percentile loss

This threshold tells us:
“On all but 5% of days, losses will not exceed this amount.”

The result is expressed as a positive number, even though it represents a negative return, a convention that keeps VaR comparable across portfolios.

This approach gives a clear, data-driven loss boundary, helping firms decide on capital requirements or whether hedging action is needed.

How do we convert a 1-day VaR into a longer-horizon VaR, and what assumptions does this rely on?
Because the simulations are typically based on daily returns, the first result is a 1-day VaR. To estimate VaR over a longer period, such as one month, apply the square-root-of-time rule: multiply the 1-day VaR by the square root of the number of trading days in the horizon (typically 22 days). This shortcut assumes that daily returns are independent, identically distributed, and roughly consistent over time. When those assumptions are reasonable, the scaled result is a useful approximation of longer-horizon risk.

Subscribe to watch

Access this and all of the content on our platform by signing up for a 7-day free trial.

Gurdip Dhami

Gurdip Dhami

Gurdip has over 25 years of experience in the financial services industry. He has had roles in corporate treasury, risk management, debt capital markets, debt advisory and credit ratings advisory. During this time Gurdip has worked at Standard Chartered Bank, Bank of America, JPMorgan, Resolution Life, and NatWest Markets. He has a BSc in Physics and MSc in Operational Research.

There are no available Videos from "Gurdip Dhami"